
Media Gives The Consumer Mixed Messages About Keeping Fit
An article in JAMA (Journal of The American Medical Association) concluded that compared to those of normal weight, heavier people have a longer lifespan. This piece of work was a collection of 97 different studies with close to 3 million people who were collected together to construct a meta-analysis for this January 2013 publication.
Since the 1970′s, meta-analysis has started getting popular with researchers. In these circumstances, a large number of studies is combined to look for patterns. What these scientists are doing is taking old data, putting it together and trying to reach statistical significance. Statistical significance shows that the data is “probably” true. The larger the number of patients and the longer the period of follow-up the more chance of hitting statistical significance with the numbers.
Let’s consider 2 different studies having different numbers of monkeys and taking place over different lengths of time. Study A had 1,000 monkeys that were treated and observed over 5 years. Study B did the same thing as study A but this time with 5,000 monkeys over 10 years. Study B with the larger set (5,000) and the longer duration (10 years) would have a better chance of getting up to statistical significance. All this comes down to is just an educated guess. So statistical significance indicates a better guess. The better the statistical number, the higher percentage that the result was NOT due to chance.
In this study published in JAMA, the researchers ignored many factors that ended up giving erroneous results. First, they combined different age groups. Second, smokers and chronically sick people were included with the healthy patients. These people should have been excluded from the study for a cleaner data set. Cleaner meaning similar in age and health status. They probably kept them all in so that the numbers would be large enough to reach statistical significance. We talked about that earlier.
You can’t look at different age categories as part of one group. Patients that are much older will start to waste away, especially with uncontrolled diabetes. Most develop diabetes as a result of excess body weight. Eventually, many develop congestive heart failure where they put on excess weight due to edema. So by allowing sick people in the grouping, you have tainted the data. These patients may live a long time but they have a low quality of life. They should have separated the studies into a least two different age groups.
Many of the under or normal weight individuals may have been smokers. Smoking dulls the taste buds and increases the metabolism so these people tend to be thinner than normal. So these smokers would have developed lung disease or cancer and perished before those that were of a higher weight category. They should have excluded all smokers and ex-smokers.
You are usually thinner if you are sick. Patients with cancer, wasting diseases (AIDS), emphysema and dementia (Alzheimer’s) could all have severe weight loss due their disease state. You get sick, lose weight and die. It’s not a question of you getting skinny for no reason what so over and passing away. Sick people should not have been part of this study.
There was an earlier integrated meta-study that looked at almost one and one-half million subjects over 10 years. It significantly concluded that being overweight increases the risk of death. That is in comparison to normal weight subjects. This data was left out of the JAMA 2013 study.
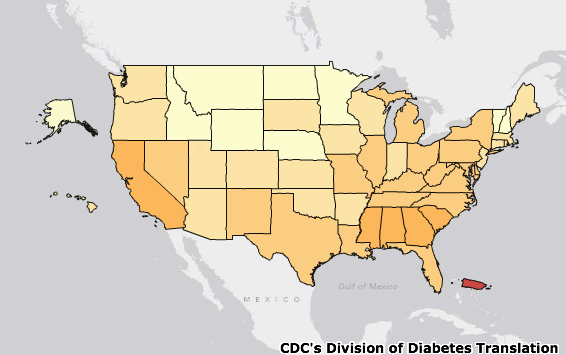
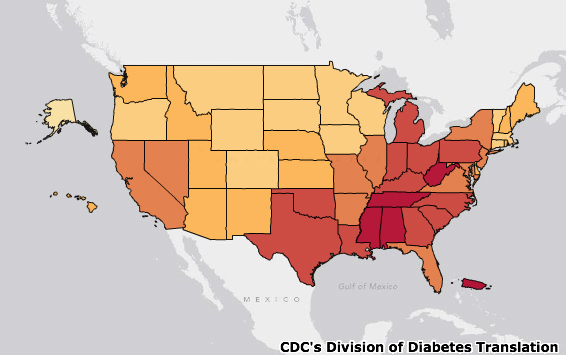
These next six slides are from the CDC (Center For Disease Control) in MD. The first 3 maps depict the spread of obesity over the last 25 years. The last 3 maps show the expansion of diabetes over the last 17 years in our population.

THE CASE FOR THE EVER EXPANDING PROBLEM OF OBESITY

Lowest Are Lightest Blue, Highest Darkest Brown-Red

6 Years Later-Still No Red Or Red-Brown
10 Years Later-Look At The Significant Changes
THE CASE FOR THE EXPLOSION OF DIABETES

1994-Diabetes Prevalence
YELLOW <4.5% DK. YELLOW 4.5-5.9% ORANGE 6.0-7.4% LT. RED 7.5-8.9% DK. RED 9.0% OR MORE
2000-Diabetes Prevalence
YELLOW <4.5% DK. YELLOW 4.5-5.9% ORANGE 6.0-7.4% LT. RED 7.5-8.9% DK. RED 9.0% OR MORE
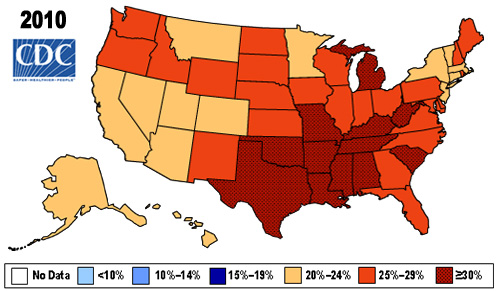
2010-Diabetes Prevalence
YELLOW <4.5% DK. YELLOW 4.5-5.9% ORANGE 6.0-7.4% LT. RED 7.5-8.9% DK. RED 9.0% OR MORE
What Can You Do To Help Make A Long High Quality Of Life Come True:
1. Weight increases your risks of all the major diseases that lead to death. You know them as diabetes, stroke, heart attack and cancer. Slowly bring your weight down to a lower number to keep it off. Fast weight loss doesn’t work and it sets you up for quicker disaster on the next attempt at weight reduction.
2. The larger the size of the waist, the more visceral fat leading to hormonal abnormalities. This leads to cancers, heart disease and diabetes.
3. Exercise helps keep those cells aging less rapidly. It also burns calories, builds up your heart and blood vessels and keeps you more mentally alert. Current evidence requests 30-60 minutes per day to maximize these benefits.
4. The healthiest diet in town is designed with seafood, poultry, fruit, vegetables, beans, whole grains, low-fat dairy, nuts, seeds and virgin olive oil.
Categories: Food, Health, Weight Loss

Leave a comment